scenario 1 • scenario 2 • land use data • calculations
|
Chris Matera, P.E., and Ellen Moyer, Ph.D, P.E. 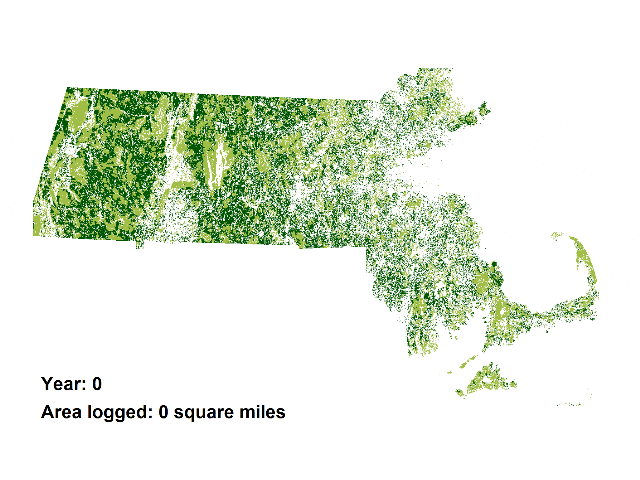
The animations add the demand for wood for 5 proposed biomass incinerators in Massachusetts to the current wood demand, which is mainly for lumber and cord wood. The animations demonstrate the land area in western and central Massachusetts that would be required to be logged to satisfy the total demand for these 5 plants which would add only about 1 percent to Massachusetts' electrical generating capacity (see calculations below). Land area logged is based on the current logging intensity of 19 green tons/acre logged (see calculations). Current logging intensity includes methods ranging from sustainable to clear-cutting. For photographic evidence of extensive clear-cutting on State-owned public land that has occurred recently, see www.maforests.org. The first scenario above removes the following forests from availability for biomass harvesting: rare species habitat, scenic landscapes, public “protected” land, and other protected open space. There are variations in either direction inherent in this approximation; some excluded land may in fact be logged (e.g., privately owned protected land), and some included land may in fact not be logged (e.g., residential lots). This scenario demonstrates that all land available for logging in central and western Massachusetts, as defined, would be logged in only 9 years. The required logging to fuel the proposed biomass incinerators clearly is not sustainable, since trees take much longer than 9 years to grow back and the negative impacts on the forest ecosystem would be massive. The second scenario represents the extreme case where all forested land in central and western Massachusetts would be made available for biomass cutting - including rare species habitat, scenic landscapes, public “protected” land, and other protected open space. In this case, all forested land in central and western Massachusetts would be logged in only 16 years. 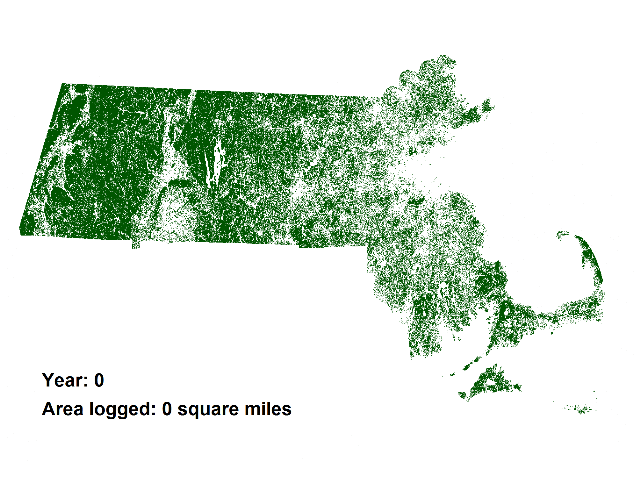
Land Use Data (return to top). Current Logging First, current conditions are evaluated, before any new large biomass incinerators are built in Massachusetts. The current total annual timber harvest (total green tons) and logging intensity (average green tons harvested per acre logged) are calculated. Timber harvests larger than 25 thousand board-feet (mbf) or 50 cords are recorded by the Massachusetts Department of Conservation and Recreation (DCR). Harvests, not including tops and branches, are reported using various units – acres, mbf, or cords – and the land area logged is also recorded. (Source: DCR, 2005 Annual Stakeholder Report: Promoting Stewardship of Our Forests for a Safe and Healthy Environment, Economy, and Society, pages 10 and 15.) Average Annual Massachusetts Timber Harvest (2001-2005 period):
Convert harvests reported in mbf or cords to green tons using the following conversion factors (Burlington Electric): 1 mbf = 2 cords 1 cord = 2.5 green tons 1 mbf = 5 green tons Tree tops and branches that would be part of biomass incinerator fuel need to be added to the harvest numbers above, using Massachusetts Department of Energy Resources information ( Biomass Availability Analysis - Five Counties of Western Massachusetts, page 13): A total of 29% additional mass is in tops and branches. Use 50% for forest biomass and leave 50% to replenish forest floor, therefore need to add 14.5% to the reported timber harvest. The total average annual Massachusetts timber harvest, including tops and branches is then: Total = [68,091 (5) + 48,563 (2.5) + 22,513] x 1.145 = 554,610 green tons Typical logging intensity = 554,610 green tons / 28,978
acres = 19 green tons per acre Next, the additional demand that would be exerted by the proposed biomass incinerators is estimated. The calculation does not include the existing 17 megawatt (MW) biomass incinerator (Pinetree) in Westminster since its demand is currently being met and any supply from Massachusetts is covered under the current logging calculation. Power reported by the biomass incinerator developers in MW is multiplied by 13,000 green tons/MW (DCR, Biomass Availability Analysis – Five Counties of Western Massachusetts Renewable Biomass from the Forests of Massachusetts, page 11.) The biomass incinerators propose to burn a combination of forest biomass and “waste wood” that includes tree tops and branches, sawmill residue, land clearing, pallets, and the woody fraction of construction and demolition (C&D) debris. Available waste wood is subtracted from the total increase in demand for wood to calculate the forest biomass needed. In addition, the biomass incinerator in Springfield proposes to burn mostly C&D wood, and only approximately 25% forest biomass, therefore its forest biomass demand is reduced accordingly. Megawatts Powered by Forest Biomass + “Waste Wood”
Forest Biomass + “Waste Wood” Needed for Proposed Incinerators Wood Demand = 190 MW x 13,000 green
tons/MW = 2,470,000 green tons Forest Biomass Needed for Proposed Incinerators Need to subtract out available “waste wood” from total wood needed for fuel. In-state reported available "waste" wood of 629,000 green tons is accounted for ( Biomass Availability Analysis - Five Counties of Western Massachusetts, page 31).
Current Plus Proposed Logging Total Forest Biomass Demand = 554,610 + 1,841,000 = 2,395,610 green tons Required Annual Acreage Proposed to Be Logged
Total Annual Cut = 2,395,610 green tons/19 green tons/acres = 126,085 acres = 197 square miles
Forest Power Generating Capacity Increase Total 2007 generating capacity = 13,557 MW ( US Government Energy Information Association)
| ||||||||||||||||||||||||